November 01, 2024
Unsupervised Learning: K-Means Clustering in Python with a Real Dataset
Ever think about how businesses divide their customers into groups so they can make better marketing plans for each one? Finding trends in data that hasn't been labelled can be hard, but that's exactly where unsupervised learning shines. In this blog post, I will use Python and a real dataset to look at K-Means clustering, which is a common way to divide customers into groups.
What is Unsupervised Learning?
A type of machine learning called unsupervised learning works with data that hasn't been labelled. This lets the algorithm find patterns and structures without knowing what the results will be. Unsupervised learning tries to figure out how the data is structured instead of using labelled datasets like supervised learning does. It is often used for market basket analysis, customer segmentation, and detecting outliers. This makes it a useful tool for making decisions based on data.
Understanding K-Means Clustering
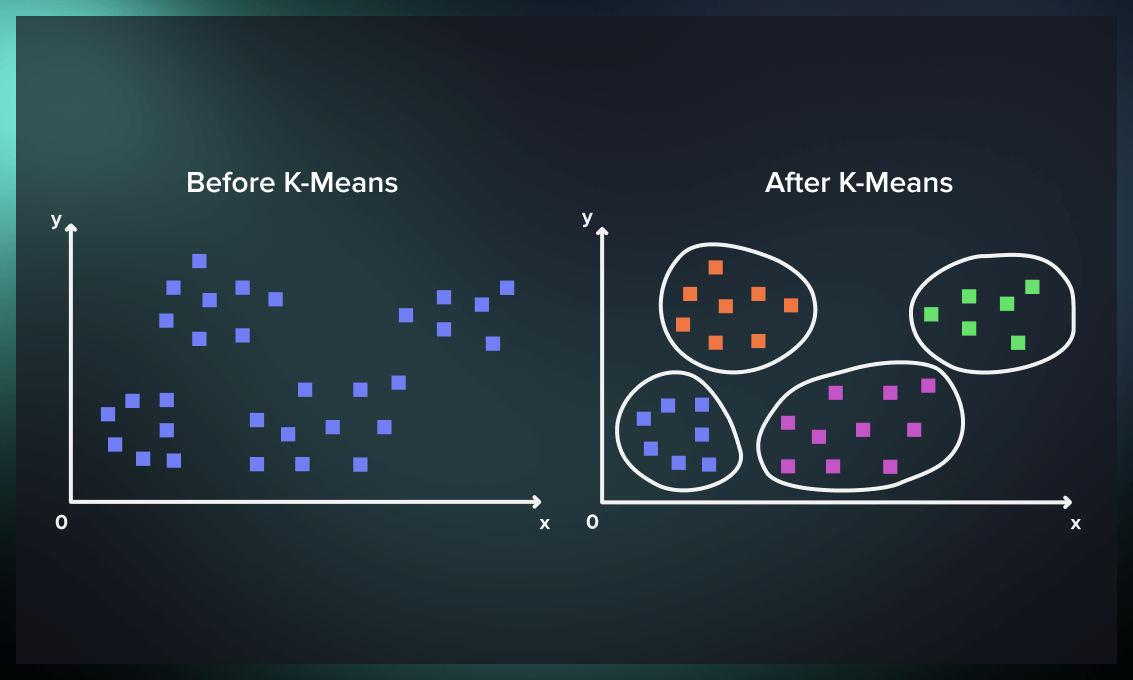
Unsupervised learning method K-Means clustering divides data into K separate clusters based on how alike their features are. At the start of the process, K initial centroids (cluster centres) are picked at random. The algorithm then puts each data point on the nearest centroid and keeps the centroids up to date by finding the mean of the assigned points. This process keeps going over and over until the centroids stay stable, which makes obvious clusters. Picking the right number of clusters (K) is very important because it has a direct effect on the results of clustering.
Setting Up the Environment
Make sure you have the right libraries installed before you start writing code. For the following example implementation, I'll use these libraries:
- NumPy for working with numbers
- Pandas for working with data
- Matplotlib for visualizing data
- And scikit-learn for the K-Means algorithm.
You can install these libraries using pip:
pip install numpy pandas matplotlib scikit-learn
Load and Explore the Dataset
I will use the Mall Customers dataset for this example. It has data about customers, such as their monthly income and expenditure score. A lot of people use this datset to look at how they segment customers into clusters.
Here's how to load and explore the dataset:
import pandas as pd

# Load the dataset
data = pd.read_csv('Mall_Customers.csv')
print(data.head())

Perform basic exploratory data analysis (EDA) to understand the structure:
print(data.info())
print(data.describe())
Implementing K-Means Clustering
Now, let's use the K-Means algorithm to divide customers into clusters based on how much money they make and spend each year. These are the steps I'll take:
- Choose the features to make clusters.
- Set up the K-Means model.
- Fit the model on the data and predict the clusters.
from sklearn.cluster import KMeans
import matplotlib.pyplot as plt

# Select features for clustering
X = data[['Annual Income (k$)', 'Spending Score (1-100)']]

# Determine the optimal number of clusters using the Elbow method
wcss = []
for i in range(1, 11):
    kmeans = KMeans(n_clusters=i, init='k-means++', max_iter=300, n_init=10, random_state=0)
    kmeans.fit(X)
    wcss.append(kmeans.inertia_)

# Plot the Elbow curve
plt.plot(range(1, 11), wcss)
plt.title('Elbow Method')
plt.xlabel('Number of clusters')
plt.ylabel('WCSS')
plt.show()

# From the Elbow method, let's assume K=5 is optimal
kmeans = KMeans(n_clusters=5, init='k-means++', max_iter=300, n_init=10, random_state=0)
y_kmeans = kmeans.fit_predict(X)
Visualizing the Results
You can better understand the segmentation statistics when you can see the clusters. I'm going to draw a graph of the clusters and their centroids. Let's see its coding:
# Visualize the clusters
plt.scatter(X.iloc[y_kmeans == 0, 0], X.iloc[y_kmeans == 0, 1], s=100, c='red', label='Cluster 1')
plt.scatter(X.iloc[y_kmeans == 1, 0], X.iloc[y_kmeans == 1, 1], s=100, c='blue', label='Cluster 2')
plt.scatter(X.iloc[y_kmeans == 2, 0], X.iloc[y_kmeans == 2, 1], s=100, c='green', label='Cluster 3')
plt.scatter(X.iloc[y_kmeans == 3, 0], X.iloc[y_kmeans == 3, 1], s=100, c='cyan', label='Cluster 4')
plt.scatter(X.iloc[y_kmeans == 4, 0], X.iloc[y_kmeans == 4, 1], s=100, c='magenta', label='Cluster 5')

# Plotting the centroids
plt.scatter(kmeans.cluster_centers_[:, 0], kmeans.cluster_centers_[:, 1], s=300, c='yellow', label='Centroids')
plt.title('Customer Segmentation using K-Means')
plt.xlabel('Annual Income (k$)')
plt.ylabel('Spending Score (1-100)')
plt.legend()
plt.show()
Conclusion
So, in this post, I examined K-Means clustering for customer segmentation. I used Python and scikit-learn to apply the algorithm to a real dataset to identify customer clusters by expenditure. Businesses can change their marketing strategy using K-Means clustering, improving client engagement and satisfaction. Why not apply it to your dataset for important insights?
1.7k views
